
So in the last blog post, I argued why it is not a good idea to use convex regions for representing concepts in a conceptual space – we are not able to represent correlations between domains. This time, I will show you how star-shaped regions can save the day.
But first of all, what does “star-shaped” mean in this context?
Let’s first recall what a convex region is:
If we have two points A and C that both belong to a convex region R, then any point B that lies somewhere between A and C must also belong to R.
That means, we can pick any two points A and C from a convex region and we know that everything between them must also belong to that region. If we fix one of these points (let’s say A), then we get the definition of a star-shaped region:
A region R is called star-shaped with respect to a point A, if for any point C, that both belongs to this region R, all points between A and C also belong to R.

Figure 1 illustrates why star-shapedness is a weaker notion than convexity. It shows a region that is star-shaped with respect to the point x0 under the Euclidean distance. You can pick any other point from this region (e.g., the point x) and you will find that everything between this point and the central point x0 is also contained in the region. The region in Figure 1 is however not convex: You can easily find two points from this region such that the line segment connecting them is not completely inside the region. This means that there are at least some star-shaped regions that are not convex. Therefore, star-shapedness is a weaker constraint than convexity.
But how does this help us?
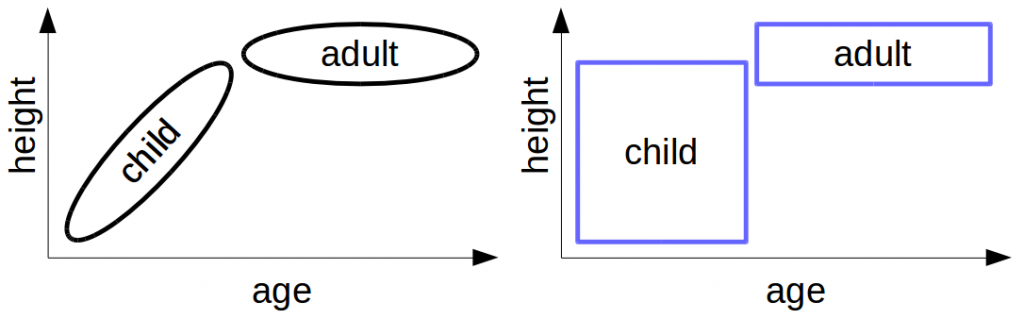
Remember our problem from last time: The left part of Figure 2 shows what we would like to represent (namely that there is a correlation between age and height in children). The right part of Figure 2 shows how this encoding looks like when we use convex regions. Because we use the Manhattan distance to combine age and height, only rectangles are convex. The resulting encoding does not allow us to represent any correlations – which in my opinion is quite problematic.
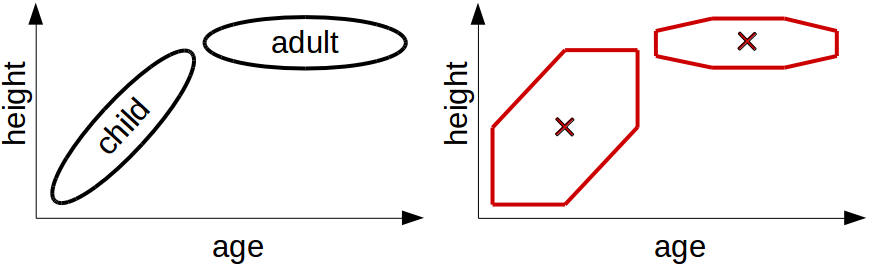
Figure 3 shows what we can do with star-shaped regions – as one can see, the result is considerably better. We can easily verify that the regions in Figure 3 are star-shaped with respect to their central points (marked by crosses): Just pick any other point in the region and check whether the rectangle between this point and the central point is completely contained in the region. One can see that this is true for all points in the region. Although the star-shaped regions in the right part of Figure 3 are not identical with the regions in the left part, they at least permit us to encode some information about the correlation. One can still clearly recognize in the right part of the figure that young children tend to be shorter than older children. We were not able to see this in the right part of Figure 1 (where we only had rectangles).
So this is a step in the right direction: If we use star-shaped regions instead of convex regions, we can geometrically represent correlations between domains. This is the first insight from my recent paper [1]. Based on this, I have specified these star-shaped region in more detail. Because if you want to write a computer program based on this, you need to know how exactly you are going to describe these star-shaped regions.
For now, let’s confine ourselves to the observation that star-shaped regions allow us to represent correlations between domains while convex regions don’t. In one of my next posts, will provide a more detailed description of the star-shaped sets I use in my approach.
References
[1] Bechberger, Lucas and Kühnberger, Kai-Uwe. “A Thorough Formalization of Conceptual Spaces” 40th German Conference on Artificial Intelligence, 2017.