
A while back, I talked about using InfoGAN networks to learn interpretable dimensions for the shape domain of a conceptual space. As this has already been a few months ago, I think it is now time for an update. Where do I stand with my research with respect to this topic?
Let me start with a bit of background:
Researchers have reported that the InfoGAN [1] neural network architecture is capable of extracting meaningful and interpretable dimensions from unlabeled data sets. You just have to specify the number of dimensions you are looking for, provide some data set, and the network will do the rest for you. This has been applied to various data sets, including MNIST (gray-scale images of hand-written digits) and CelebA (faces of celebrities). As we are interested in interpretable dimensions for defining a conceptual space, I thought: “Well, let’s apply this to a data set of shapes. Maybe we find interpretable dimensions that we can use for spanning the shape domain in a conceptual space.”
Last summer, I found two Master students at my institute that were also interested in this topic. So I asked them to create a simple data set of shapes (rectangles, triangles, and ellipses) and to apply the original InfoGAN code that the developers had made publicly available on GitHub. After having solved a few technical issues, they managed to train the network on their artificial data set (their code can be found here). After training the network for 500 epochs (which is ten times as long as reported in the InfoGAN paper for the MNIST example), the generator part of the InfoGAN was able to create the shapes shown in Figure 1.

As you can see, the generated shapes are not perfect (especially the leftmost one is neither an ellipse, nor a rectangle, nor a triangle), but at least we don’t get random noise. Now in order to check whether the two extracted dimensions are actually interpretable, one can vary the value on one of these dimensions and see whether the generated images change. This is shown in Figure 2 where each row corresponds to a different value on the first extracted dimension.
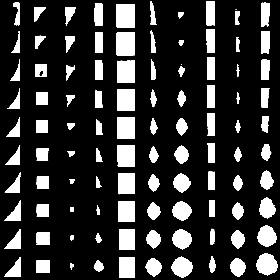
As you can see, the generated shapes indeed do change as you change the value on this dimension. However, it is not quite clear how to interpret this change: The leftmost shape changes from something weird into a triangle, whereas the rightmost shape changes from a rectangle to an ellipse. The rectangle in the middle in contrast does not change much at all, it only becomes a tiny bit smaller. So although the network is able to generate more or less reasonable shapes, we do not get interpretable dimensions in this case.
The problem at this point is that we did not have a clear expectation about how many dimensions we need (we simply tried with two) and what kinds of dimensions we expected to find. That makes it hard to “debug” the behavior of the network: After all, how do you decide whether changing a specific hyperparmeter makes your results “better” if you have no clear idea what a “good” result looks like?
So I decided to simplify the problem.
What I am looking at currently is a simplified case where we only have rectangles that are centered in the image. This means, that the only two parameters that change in the data set are the width and the height of the rectangle – position, rotation and type of shape stay constant. This seems to be a fairly trivial scenario, but at least we know exactly how many dimensions we need and what these dimensions should express (namely, width and height). So I re-ran the whole thing with this simplified data set.
Using the original InfoGAN implementation was however causing some problems: On the one hand, the training seemed to be quite instable (about 85% of the runs crashed before finishing training). On the other hand, because this implementation uses an outdated version of TensorFlow, I was not able to run the code on GPU, which significantly slowed down the training process. However, when the code ran through I got results like in Figure 3 and 4.
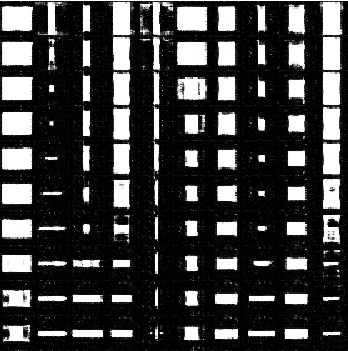
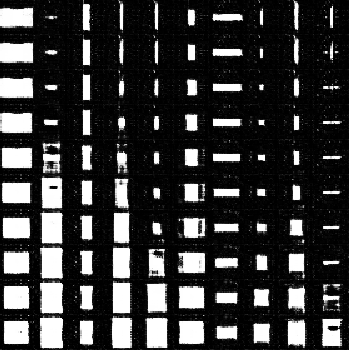
Most of the samples do look like rectangles (although there are many artifacts), but the extracted dimensions do not correspond to width and height. What we would have expected is that for one of the dimensions all the samples in the top row are very tall and all the samples in the bottom row are very short while the intermediate rows show a reasonably smooth morph between the two end points (this would encode the “height” dimension). For the other dimensions we would have expected a similar result with wide and narrow rectangles (encoding the “width” dimensions). But as you can see from Figures 3 and 4, this is unfortunately not the case.
As you can see, my results so far have been quite disappointing (especially when comparing them to the results reported in the original InfoGAN paper [1]). However, I’m not willing to give up, yet.
There are still many hyperparameters to play around with and many paths to explore. In order to use the full power of the GPUs available at my institute, my next step consists in setting up the InfoGAN code with a more recent version of TensorFlow. Luckily, the TensorFlow developers recently announced TFGAN, a library for training all kinds of GAN networks. This seems like a good starting point and I’m looking forward to many more InfoGAN experiments with hopefully better results.
References
[1] Chen, Xi, et al. “InfoGAN: Interpretable Representation Learning by Information Maximizing Generative Adversarial Nets.” Advances in Neural Information Processing Systems, 2016