
This blog post closes the “A Hybrid Way: Reloaded” mini-series. So far, I have analyzed the MDS solutions in part 1 and investigated first regression results in part 2 (with respect to the effects of feature space, correct vs. shuffled targets, and regularization). Today, I want to analyze what happens if we use different MDS algorithms for constructing the similarity spaces and to what extent our regression results depend on the number of dimensions in the similarity space.
Question 1: Is there a difference between metric MDS and nonmetric MDS with respect to the regression results?
Last time, we have only looked at the four-dimensional similarity space that Horst and Hout [1] have obtained using metric MDS. Previously, I had investigated whether there are any differences between metric and nonmetric MDS on our data set. My conclusion back then: There are no notable differences. Let’s see whether this also holds for our regression task.
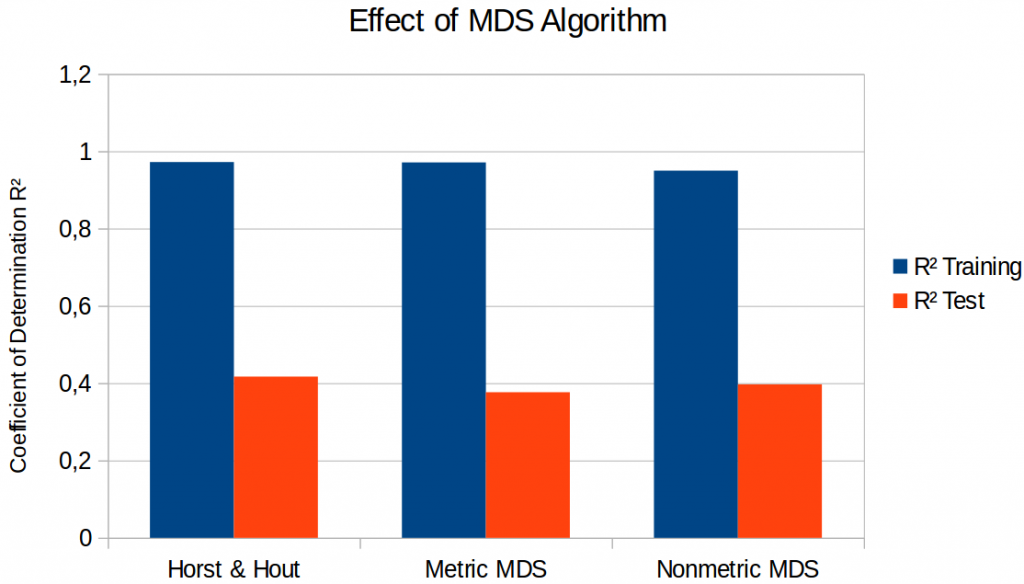
Figure 1 compares the results on three different four-dimensional spaces: The one by Horst and Hout (as discussed in the previous blog post), the one obtained by metric SMACOF, and the one obtained by nonmetric SMACOF. I only show the results for the lasso regression here, as they were in all cases better than the ones obtained by a simple linear regression.
As we can see in Figure 1, there are some differences, but they are very small and not very systematic: It seems that metric SMACOF results in slightly poorer performance on the test set than the two other variants. One might be tempted to say “looks like metric MDS is bad”. However, also the space of Horst and Hout was obtained with metric MDS. Nonmetric SMACOF does not give better regression performance than the space of Horst and Hout, so we cannot talk about any systematic differences between metric and nonmetric MDS. Therefore, it seems that also for the regression task, the choice of the MDS algorithm is not very crucial.
Question 2: How many dimensions should the similarity space have?
Finally, let’s move past the four-dimensional space and also take a look at similarity space with fewer or more dimensions. Figure 2 shows the results for spaces obtained with nonmetric SMACOF using a lasso regressor.
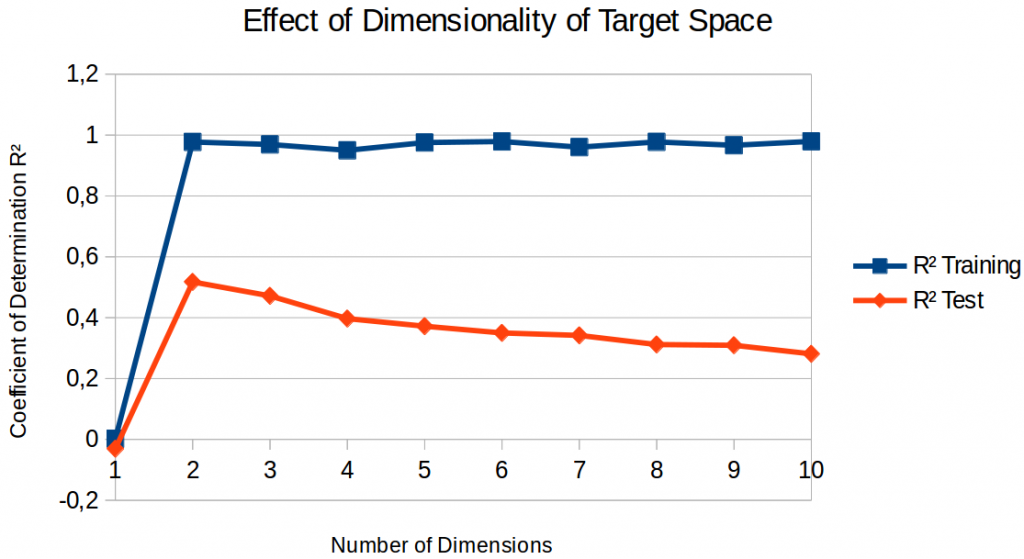
If we only look at the performance on the training set, we observe that a one-dimensional space is clearly not sufficient for getting anything done – the coefficient of determination is practically zero. That is, predicting a constant point is the optimal strategy – which is not very useful in practice. As soon as the similarity space has at least two dimensions, training set performance is almost perfect and quite stable for different numbers of dimensions.
If we look at test set performance, we see a clear performance peak: A two-dimensional target space gives us the best regression results. Adding more dimensions makes the regression less and less successful. But why? I assume that there are two underlying effects:
On the one hand, the similarity space needs to have a meaningful structure in order to make generalization possible. As we have seen in the analysis of metric vs. nonmetric MDS, adding more dimensions to the similarity space in general improves its representational power – similarities can be represented more accurately. By this reasoning, a high-dimensional similarity space would be superior.
On the other hand, adding more dimensions to the similarity space makes the regression problem harder: For each dimensions of the target space, we need to estimate 2,049 parameters (2,048 features plus one intercept). Adding output dimensions thus means increasing the number of free parameters in the model. And more free parameters without more training data leads to an increased risk for overfitting. By this reasoning, a low-dimensional similarity space would be superior.
The first effect can be seen by the very poor performance of a one-dimensional space: As we have already seen in our analysis of the similarity spaces (part 1 of this little series), we are not able to represent the similarities very well using only a single dimension. Therefore, the regression is also not very successful. The second effect seems to dominate for all higher-dimensional spaces: The added risk of overfitting seems to outweigh the improved semantic structure of the target space, making a regression to higher-dimensional spaces less successful.
Summary & Outlook
In this blog post, we have made two observations: On our data set, there is no difference between metric and nonmetric MDS with respect to our regression task. The number of dimensions used for the similarity space however does have a considerable impact on the regression results. In our case, a two-dimensional space seems to be the optimal choice.
If we also consider the observations from last time, it seems that the proposed approach (learning a mapping from images to points in psychological similarity spaces) is viable in principle, but that there is still room for improvement. The values of R² that I was able to achieve on the test set are still too low for any practical applications, but my hope is that finding a remedy for the massive overfitting problem will also improve the quality of the results in general.
The source code and the raw results for all of my experiments can be found in my GitHub project, a more extensive and formal report of the study has been submitted as a book chapter and can be found on arXiv.
I’ve already started working on a second study using a data set of shapes where I hope to confirm and extend the results reported so far.
References
[1] Horst, J. S. & Hout, M. C.: “The Novel Object and Unusual Name (NOUN) Database: A Collection of Novel Images for Use in Experimental Research” Behavior Research Methods, 2016, 48, 1393-1409.
4 thoughts on “A Hybrid Way: Reloaded (Part 3)”