
In a previous mini-series of blog posts (see here, here, here, and here), I have introduced a small data set of 60 line drawings complemented with pairwise shape similarity ratings and analyzed this data set in the form of conceptual similarity spaces. Today, I will start a new mini-series about learning a mapping from images into these similarity spaces, following up on my prior work on the NOUN dataset (see here and here).
Overall Approach
But before we start, let’s briefly recap the overall idea of my proposed hybrid approach (as introduced here and here): If you use psychological similarity ratings for constructing a conceptual space, your data is clearly grounded in cognition, but it is often difficult to generalize the obtained similarity space to novel stimuli. Conceptual spaces obtained through artificial neural networks on the other hand are psychologically much less plausible, but are typically able to generalize reasonably well to unseen inputs.
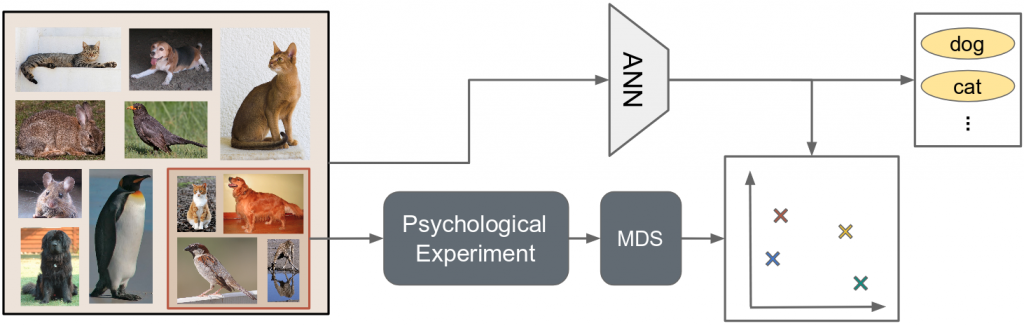
Figure 1 illustrated the proposed hybrid approach which aims to combine the strengths of both methods: We select a representative subset of our domain of interest (here: images of animals) and conduct a psychological experiment in order to initialize our conceptual space through multidimensional scaling (MDS). We then train an artificial neural network (ANN) on the overall data set using a secondary task such as classification or reconstruction. This secondary task incites the network to learn an internal representation of its inputs which can be expected to reflect their pairwise similarities at least partially. By also training the network to predict the correct coordinates in the conceptual space for all inputs from the initially selected subset, we obtain a way to map raw inputs onto points in a psychologically grounded similarity space.
In our first feasibility study on the NOUN data set, we used a simple linear regression on top of a pre-trained neural network in order to test our idea. While the results were anything but impressive, they nevertheless showed that this idea can work in principle. In the meantime, related research by Sanders and Nosofsky has shown that using a more complex regression setup can help to obtain considerably better performance. In the current study, I thus try to improve the mapping performance by training a deep neural network from scratch, using the shape similarity spaces as a target.
Using Sketches as Additional Data
Please remember that our shapes data set contains only 60 line drawings. Although we have 70 additional line drawings in a similar style which were not used in the psychological study, the overall number of examples is still considerably too small for applying machine learning. We therefore need additional sources of data.
Unfortunately, it seems that there are no large-scale data sets of line drawings. However, researchers in the sketch recognition field have compiled various data bases for their own specific needs. If sketches are of sufficiently high quality, they can be thought of as reasonably similar to line drawings, sharing many of their characteristics such as being made of black lines on white background. They are certainly a better match than photographs which also include color and texture information as well as objects in the background.
As it turns out, there are three major sketch data sets which may be useful for our study: The TU Berlin corpus, Sketchy, and QuickDraw. Figure 2 provides a short comparison of these three data sets, showing also some example sketches for three given categories.
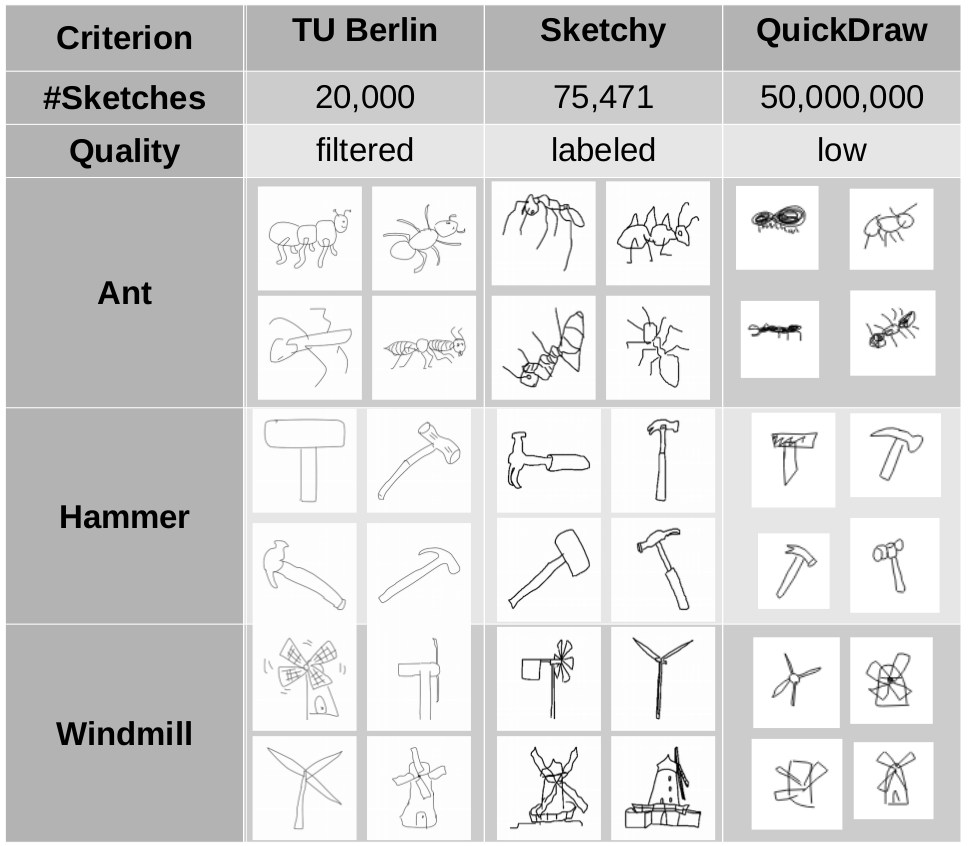
The sketches in the TU Berlin corpus were collected by prompting participants with a category name and then letting them freely sketch an object from the category, while in the Sketchy database, sketches are based on concrete images. For both data sets, participants took about 85 seconds per sketch, and the resulting collection of sketches has been manually annotated by the experimenters in order to remove inappropriate sketches. The QuickDraw data set is considerably larger, but the quality of sketches is considerably lower, since participants had to make their sketch within 20 seconds. Moreover, there has not been any manual quality control.
Since the QuickDraw sketches seem to be too noisy in comparison to our line drawings, we decided to use only the TU Berlin corpus and Sketchy as additional data sources for our study.
Data Augmentation
Now we have a relatively large number of sketches, but still a quite small number of line drawings with target coordinates. Since we also need enough data to train the mapping task, we need to use data augmentation techniques to increase the input variety.
Our data augmentation pipeline consists of the following steps: In the beginning, we detect the bounding box of the object in the image and cut it out. We then rescale the content of this bounding box such that its longest side has a randomly selected length between 98 and 128 pixels. This image patch is then placed into a randomly selected location in a quadratic image of 128 by 128 pixels, where remaining pixels are filled with white. Finally, we apply some salt and pepper noise by setting a random subset of pixels to black and white, respectively. The amount of noise to insert in this last augmentation step is a hyperparameter that will be varied in our experiments.
Overall, we create a data set of 750,000 augmented images, where 240,000 are based on TU Berlin, another 250,000 are based on Sketchy, and the remaining 260,000 are based on the 130 line drawings. This means that we use considerably larger augmentation factors for the line drawings than for the Sketch data sets.
We can already state at this point that two thirds of our data set can be used for classification (namely, the parts based on TU Berlin and Sketchy), and that one sixth of our data set contains target coordinates for the mapping task (namely, the examples based on our original 60 images from the psychological study). Finally, the whole data set can be used to train a reconstruction objective, since this does not require any labels.
Outlook
Okay, so now we have a data set of line drawings and sketches. But what now? Well, in the next blog post, I will talk a bit about our network structure and about our approach for evaluating its performance. We will then set up different experiments and hopefully learn something useful by looking at their results. Stay tuned!
3 thoughts on “Learning To Map Images Into Shape Space (Part 1)”